> ## Documentation Index
> Fetch the complete documentation index at: https://docs.a2v2.ai/llms.txt
> Use this file to discover all available pages before exploring further.
# Usage Dashboard
> Monitor credit usage across every agent and team member, filter by agent and date range, and catch a runaway agent before it drains your balance.
It's the middle of the month and your credit balance is lower than you expected.
Which agent is responsible — the busy support bot, or the new one you embedded last
week? The **Usage** dashboard answers exactly that: it shows credit spend across
your whole organization, broken down by agent and over time, so you can find the
cause instead of guessing.
Open it from **Usage** in the dashboard sidebar (alongside Settings). Its subtitle
says it plainly: *"Monitor credit usage across your agents and team."*
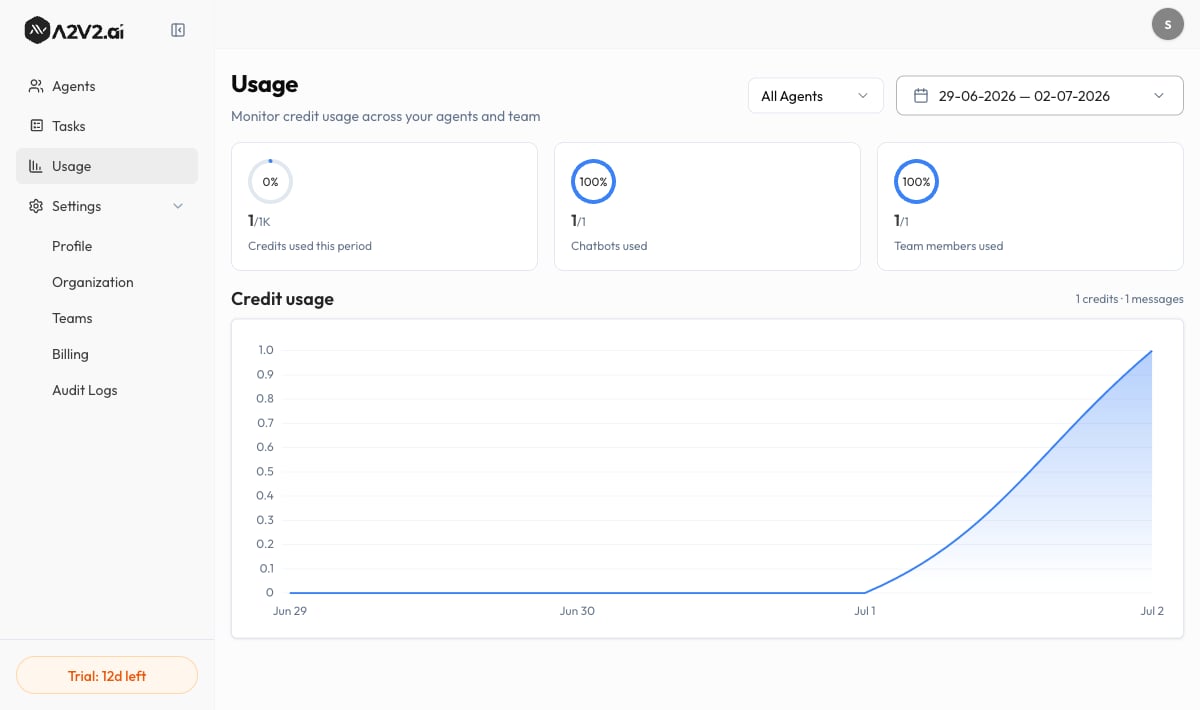 ## What's on the dashboard
Usage is read-only — it reports what's already happened. You'll see a set of summary
figures and a trend chart, both responding to the agent and date filters at the top.
### Summary figures
| Figure | What it shows |
| ----------------------------------------------- | ----------------------------------------------------------------------------- |
| **Credits used** / **Credits used this period** | Total credits consumed in the selected range (or the current billing period). |
| **Chatbots used** | How many of your available agent slots are in use. |
| **Team members used** | How many of your team-member seats are in use. |
**Credits used** here is *spend* — how many credits have been consumed. It is not
your remaining balance. To see what's left and when it refills, open **Billing**
(see [Credits explained](/billing/credits-explained)).
### The Credit usage chart
The **Credit usage** chart plots consumption over the selected date range, so you
can see spikes (a launch, a viral day) against quiet stretches. The chart can show
the trend two ways:
* **credits** — the credits consumed in each interval.
* **messages** — the underlying message volume that drove that spend.
Comparing the two tells you whether a spend spike came from *more conversations* or
from a *pricier model* answering them.
## Filter to find the cause
Use the agent filter at the top — **All Agents** by default — and choose
**Select Agent** to isolate a single agent's credit usage. This is how you
confirm which agent is driving spend.
Use the date range picker (*Start date – End date*) to focus on a billing
period, a launch week, or a custom window. The figures and chart update to match.
Toggle the chart between **credits** and **messages** to see whether a spike is
volume-driven or model-driven.
## Options reference
| Control | What it does | Notes |
| ----------------------------- | ------------------------------------------------------- | ------------------------------ |
| **All Agents** | Shows usage summed across every agent | Default view |
| **Select Agent** | Filters all figures and the chart to one agent | Use to isolate a heavy spender |
| **Date range** | Sets the period the dashboard reports on | Start date – End date |
| **Credit usage chart toggle** | Switches the trend between **credits** and **messages** | Same data, two lenses |
## Usage vs. Billing — what's different
The Usage dashboard and the **Billing** page show related but distinct things. Don't
redraft your balance math from Usage — read it on Billing:
| You want to know… | Look at… |
| ----------------------------------------------------------------- | ----------------------------------------------------------------- |
| How many credits I've *spent*, by agent, over time | **Usage** (this page) |
| My *remaining* balance, **Message Credits** vs **Top-up Credits** | **Billing** → see [Credits explained](/billing/credits-explained) |
| My **Next Billing Date** and days remaining | **Billing** |
| How to top up automatically | [Auto-recharge](/billing/auto-recharge) |
If one agent is consistently the biggest spender, check the model it uses on
[Model & settings](/building/model-settings). A lighter model can cut per-message
cost substantially while still answering well from a strong knowledge base.
## Troubleshooting
Usage only appears once your live, embedded agents have answered messages in the
selected range. Testing in the **Playground** doesn't draw credits, so it won't
show here. Widen the date range or confirm the agent is public and embedded.
A temporary hiccup can stop a range from loading. Re-apply the date range or
reload the page to retry. If it persists, contact
[support@a2v2.ai](mailto:support@a2v2.ai).
They measure different things. Usage shows credits *spent*; Billing shows credits
*remaining*. Your balance also depends on plan refills and any top-ups — see
[Credits explained](/billing/credits-explained).
## Related
Go beyond cost — see how a single agent is performing.
The two credit pools, what spends them, and what happens at zero.
Top up automatically so a busy spell can't take agents offline.
What each plan includes and how many credits it gives you.
## What's on the dashboard
Usage is read-only — it reports what's already happened. You'll see a set of summary
figures and a trend chart, both responding to the agent and date filters at the top.
### Summary figures
| Figure | What it shows |
| ----------------------------------------------- | ----------------------------------------------------------------------------- |
| **Credits used** / **Credits used this period** | Total credits consumed in the selected range (or the current billing period). |
| **Chatbots used** | How many of your available agent slots are in use. |
| **Team members used** | How many of your team-member seats are in use. |
**Credits used** here is *spend* — how many credits have been consumed. It is not
your remaining balance. To see what's left and when it refills, open **Billing**
(see [Credits explained](/billing/credits-explained)).
### The Credit usage chart
The **Credit usage** chart plots consumption over the selected date range, so you
can see spikes (a launch, a viral day) against quiet stretches. The chart can show
the trend two ways:
* **credits** — the credits consumed in each interval.
* **messages** — the underlying message volume that drove that spend.
Comparing the two tells you whether a spend spike came from *more conversations* or
from a *pricier model* answering them.
## Filter to find the cause
Use the agent filter at the top — **All Agents** by default — and choose
**Select Agent** to isolate a single agent's credit usage. This is how you
confirm which agent is driving spend.
Use the date range picker (*Start date – End date*) to focus on a billing
period, a launch week, or a custom window. The figures and chart update to match.
Toggle the chart between **credits** and **messages** to see whether a spike is
volume-driven or model-driven.
## Options reference
| Control | What it does | Notes |
| ----------------------------- | ------------------------------------------------------- | ------------------------------ |
| **All Agents** | Shows usage summed across every agent | Default view |
| **Select Agent** | Filters all figures and the chart to one agent | Use to isolate a heavy spender |
| **Date range** | Sets the period the dashboard reports on | Start date – End date |
| **Credit usage chart toggle** | Switches the trend between **credits** and **messages** | Same data, two lenses |
## Usage vs. Billing — what's different
The Usage dashboard and the **Billing** page show related but distinct things. Don't
redraft your balance math from Usage — read it on Billing:
| You want to know… | Look at… |
| ----------------------------------------------------------------- | ----------------------------------------------------------------- |
| How many credits I've *spent*, by agent, over time | **Usage** (this page) |
| My *remaining* balance, **Message Credits** vs **Top-up Credits** | **Billing** → see [Credits explained](/billing/credits-explained) |
| My **Next Billing Date** and days remaining | **Billing** |
| How to top up automatically | [Auto-recharge](/billing/auto-recharge) |
If one agent is consistently the biggest spender, check the model it uses on
[Model & settings](/building/model-settings). A lighter model can cut per-message
cost substantially while still answering well from a strong knowledge base.
## Troubleshooting
Usage only appears once your live, embedded agents have answered messages in the
selected range. Testing in the **Playground** doesn't draw credits, so it won't
show here. Widen the date range or confirm the agent is public and embedded.
A temporary hiccup can stop a range from loading. Re-apply the date range or
reload the page to retry. If it persists, contact
[support@a2v2.ai](mailto:support@a2v2.ai).
They measure different things. Usage shows credits *spent*; Billing shows credits
*remaining*. Your balance also depends on plan refills and any top-ups — see
[Credits explained](/billing/credits-explained).
## Related
Go beyond cost — see how a single agent is performing.
The two credit pools, what spends them, and what happens at zero.
Top up automatically so a busy spell can't take agents offline.
What each plan includes and how many credits it gives you.