Analytics is in Beta. The reports are live and useful today, but they’re still
expanding. Some tabs may show a “coming soon” state — “We’re building this out
next. Overview is live today.” — while they roll out.
The date range, everywhere
Every report responds to the date range picker at the top. You can pick a preset — Last 7 days, Last 30 days, Last 90 days, Month to date — or a Custom range, and optionally Compare to previous period to see whether a number is trending up or down.Overview — engagement at a glance
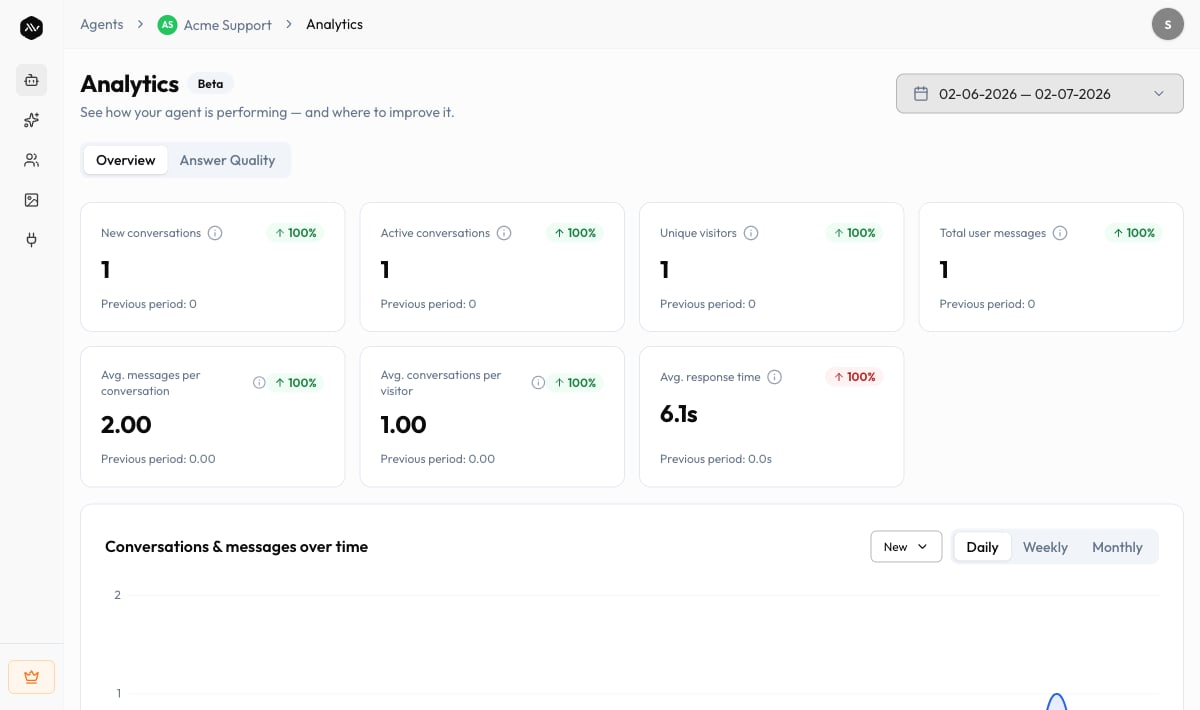
The Overview tab is the live heart of Analytics. It answers “are people using this, and how much?” with a row of key figures and trend charts.Key figures
| Metric | What it tells you |
|---|---|
| New conversations | Chats that started during the selected period. |
| Active conversations | Chats with any activity — a visitor or bot message — in the period, even if they started earlier. |
| Unique visitors | How many different visitors chatted. Anonymous web visitors are counted per device/browser, so one person on two devices counts as two. |
| Total user messages | Total messages sent by visitors in the period. |
| Avg. messages per conversation | How deep conversations go on average — higher usually means deeper engagement. |
| Avg. conversations per visitor | How often visitors come back — higher means returning users. |
| Avg. response time | Average time the agent took to start replying, in seconds. Lower is better. |
Trend charts
- Conversations & messages over time — new vs. active conversations, and message volume, plotted across the range. Switch the granularity between Daily, Weekly, and Monthly to zoom in or out.
- Busiest hours — when your visitors actually show up, so you know when the agent carries the most load.
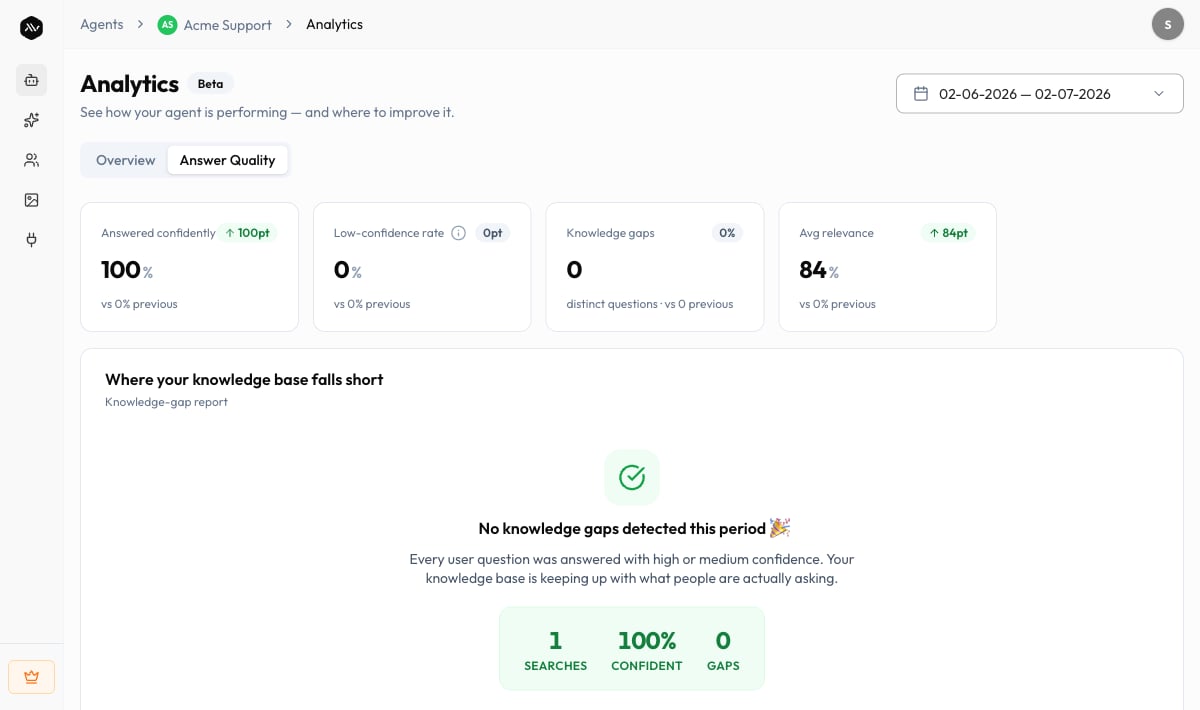
Answer Quality — find what your agent can’t answer
The Answer Quality tab is where Analytics earns its keep for a knowledge-base agent. Instead of just counting chats, it scores how confidently the agent answered and surfaces the knowledge gaps — the real questions visitors asked that your knowledge base couldn’t confidently cover. What you’ll find here:- Knowledge-gap report — “Where your knowledge base falls short.” A ranked list of questions, how many times each was asked, their average relevance, and when they were last asked. Each row has an Add to KB action so you can write the missing answer on the spot — it goes live on the next search.
- Confidence distribution — how your knowledge-base searches split across High confidence, Medium confidence, Low confidence, and No match, based on retrieval relevance scoring.
- Most-used and Underused documents — which sources are earning their place (cited most) and which were never cited this period and might be pruned.
Answer Quality depends on adaptive retrieval being enabled for the agent. If it’s
off, this tab prompts you to turn it on before it can score searches and surface
gaps. Tracking is forward-only — gaps and document usage are measured from the
point adaptive retrieval was switched on, not retroactively.
Subscriptions — revenue from paid agents
If your agent uses Pay for Access, the Subscriptions view tracks what it’s earning: “Track revenue, subscribers, and transactions from paid access.” You can also reach it from the agent’s View Subscriptions action.| Metric | What it shows |
|---|---|
| Total Subscription Amount | Total revenue earned from paid access. |
| Total Subscribers | How many people have purchased access. |
| Total Hours Used / Remaining Hours | Usage across all your subscribers. |
| Revenue Over Time | A revenue trend chart for the selected period. |
Setting the paywall up (price, access duration, message allowance) happens on
Paid Agents — this view is where you track the result.
Tabs reference
| Tab | What it covers | Notes |
|---|---|---|
| Overview | Conversations, messages, visitors, response time, busiest hours | Live today |
| Answer Quality | Knowledge gaps, confidence distribution, document usage | Requires adaptive retrieval; forward-only |
| Subscriptions | Paid-access revenue, subscribers, transactions | For Pay-for-Access agents |
| Performance & Cost | — | Rolling out — may show “coming soon” |
| Outcomes | — | Rolling out — may show “coming soon” |
Troubleshooting
No conversations yet for this range
No conversations yet for this range
Analytics populates as visitors chat. Share your agent’s link or embed it, then
check back — “Analytics will populate as visitors begin chatting.” Testing in
the Playground doesn’t count toward these figures.
The Answer Quality tab is asking me to enable something
The Answer Quality tab is asking me to enable something
Answer Quality needs adaptive retrieval turned on for the agent. Enable it,
then let the agent answer some searches — gaps and confidence scores build up
from that point forward.
A tab says 'coming soon'
A tab says 'coming soon'
Analytics is in Beta. Overview is live today; other tabs are rolling out and
will populate as they ship.
We couldn't load analytics
We couldn't load analytics
A temporary error can interrupt a report — “Your data is safe.” Use Retry,
or contact support@a2v2.ai if it keeps happening.
Related
Usage dashboard
Credit spend across every agent and team member.
Conversation history
Read the actual transcripts behind these numbers.
Paid Agents
Set up the paywall whose revenue you track here.
Knowledge Base
Close the gaps Answer Quality surfaces.