What’s on the dashboard
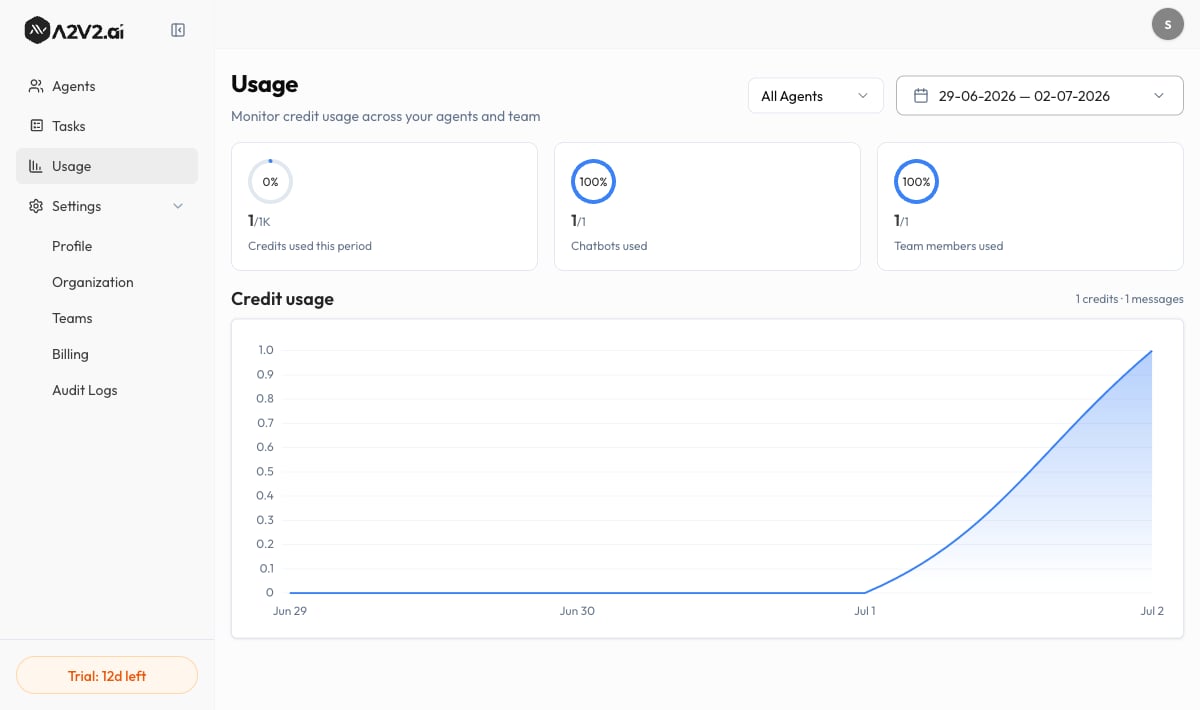
Usage is read-only — it reports what’s already happened. You’ll see a set of summary figures and a trend chart, both responding to the agent and date filters at the top.Summary figures
| Figure | What it shows |
|---|---|
| Credits used / Credits used this period | Total credits consumed in the selected range (or the current billing period). |
| Chatbots used | How many of your available agent slots are in use. |
| Team members used | How many of your team-member seats are in use. |
Credits used here is spend — how many credits have been consumed. It is not
your remaining balance. To see what’s left and when it refills, open Billing
(see Credits explained).
The Credit usage chart
The Credit usage chart plots consumption over the selected date range, so you can see spikes (a launch, a viral day) against quiet stretches. The chart can show the trend two ways:- credits — the credits consumed in each interval.
- messages — the underlying message volume that drove that spend.
Filter to find the cause
Narrow to one agent
Use the agent filter at the top — All Agents by default — and choose
Select Agent to isolate a single agent’s credit usage. This is how you
confirm which agent is driving spend.
Pick a date range
Use the date range picker (Start date – End date) to focus on a billing
period, a launch week, or a custom window. The figures and chart update to match.
Options reference
| Control | What it does | Notes |
|---|---|---|
| All Agents | Shows usage summed across every agent | Default view |
| Select Agent | Filters all figures and the chart to one agent | Use to isolate a heavy spender |
| Date range | Sets the period the dashboard reports on | Start date – End date |
| Credit usage chart toggle | Switches the trend between credits and messages | Same data, two lenses |
Usage vs. Billing — what’s different
The Usage dashboard and the Billing page show related but distinct things. Don’t redraft your balance math from Usage — read it on Billing:| You want to know… | Look at… |
|---|---|
| How many credits I’ve spent, by agent, over time | Usage (this page) |
| My remaining balance, Message Credits vs Top-up Credits | Billing → see Credits explained |
| My Next Billing Date and days remaining | Billing |
| How to top up automatically | Auto-recharge |
Troubleshooting
The chart says no usage data for this period
The chart says no usage data for this period
Usage only appears once your live, embedded agents have answered messages in the
selected range. Testing in the Playground doesn’t draw credits, so it won’t
show here. Widen the date range or confirm the agent is public and embedded.
Usage couldn't load for this range
Usage couldn't load for this range
A temporary hiccup can stop a range from loading. Re-apply the date range or
reload the page to retry. If it persists, contact
support@a2v2.ai.
Credits used here doesn't match my balance on Billing
Credits used here doesn't match my balance on Billing
They measure different things. Usage shows credits spent; Billing shows credits
remaining. Your balance also depends on plan refills and any top-ups — see
Credits explained.
Related
Agent Analytics (Beta)
Go beyond cost — see how a single agent is performing.
Credits explained
The two credit pools, what spends them, and what happens at zero.
Auto-recharge
Top up automatically so a busy spell can’t take agents offline.
Plans
What each plan includes and how many credits it gives you.